Real Simulation - FDDA option
1.1 What is FDDA (Four-Dimensional Data Assimilation)?
Apart from relying solely on CPAS real simulation to carry out time-integration of the atmospheric state from the initial condition onward, FDDA, which is also known as nudging, has long been a technique that combines real simulation data with a set of reference data (called FDDA data source with choices GFS / FNL / ERA5 in CPAS cloud-computing service). In CPAS v0.15.0 or above, FDDA was ported from [1]. Only gridded nudging data (“analysis nudging”) is supported. The “obs nudging” feature as in WRF was not supported yet. See [1] or WRF documentation [2] to understand what “analysis nudging” and “obs nudging are”.
For retrospective real simulation, the FDDA data source can be reanalysis data, with observation data already assimilated. There is a well-known usage of FDDA for retrospective air quality modeling as introduced by Bullock’s seminal work of implementing FDDA on MPAS-A v4.0 [1]. Using FDDA with a good data source in CPAS retrospective real simulation may guide the simulation along known observed atmospheric states.
For forecasting, turning on FDDA and selecting a set of forecast data (the only choice is GFS in CPAS by now) as reference data to nudge toward may be a cost-effective technique for conducting a real simulation. For example, if the user’s customized CPAS mesh has a large region (complement of the region of interest with transition zone) with resolution significantly coarser than the FDDA data source (GFS has 0.25 degree resolution, approximately 28km resolution, at present) so that the simulated atmospheric state of those coarse regions is expected to be less accurate than GFS, then nudging with GFS data (use “scaled” FDDA to be explained below) may be beneficial.
1.2 FDDA Options
The choices for Data source for nudging data are the same as those for initial condition.
The Update frequency is the interval between time slides of FDDA reference data to be used. Interpolation is applied from the two time slides enclosing the simulated time to generate the guiding tendencies for the real simulation. The number of hours for this interval must be a multiple of that available from the data source.
The FDDA scheme can be either “Analysis”, meaning the same nudging strength is applied regardless of the horizontal resolution variation of the CPAS mesh, or “Scaled”, in which the nudging strength changes linearly from fully on for horizontal resolution coarser than “Scale max (km)” to fully off for horizontal resolution finer than “Scale min (km)”.
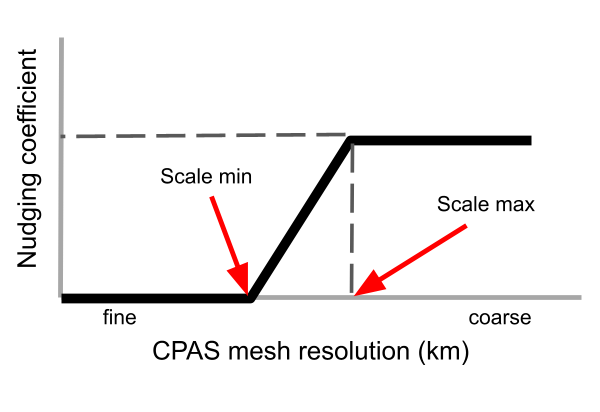
Usually, the user would use a finer resolution for the region of interest than the FDDA reference data. The static data (terrain, land cover/land use, etc) used in the fine resolution region is expected to drive the CPAS real simulation to give smaller spatial and temporal features and more accurate predictions than the FDDA reference data, and hence the “Scale min” and “Scale max” setting shall be determined accordingly to preserve such features.
Three atmospheric state quantities can be nudged:
- potential temperature
- wind (zonal and meridional components)
- water vapor mixing ratio
For each of the atmospheric state quantities, if turned on to apply nudging, the following options are available:
Nudging coefficient - please see [1] for the nudging formula and the meaning of the coefficient. The default values follow those in [1]. Note that the nudging coefficient for water vapor mixing ratio usually is an order of magnitude smaller than those for potential temperature and wind, because unlike for temperature and wind, nudging water vapor concentration perturbs atmospheric mass in the simulation.
Whether to nudge in PBL (Planetary Boundary Layer) and the Lowest layer to nudge - The fine static data are on the land surface, and convection-related processes occur within the PBL above the Earth surface. The real simulations are usually targeted to deliver accurate forecasts / retrospective analysis for the lower air with small spatiotemporal scale variability. It would be less meaningful to apply FDDA in PBL or lower model layers, in which FDDA may smooth out the small scale variability.
1.3 Acknowledgement
The porting of the FDDA feature to CPAS was supported by the Innovation and Technology Fund of Hong Kong [B/E048/19].
1.4 Reference
[1] Bullock Jr., O. R., Foroutan, H., Gilliam, R. C., and Herwehe, J. A.: Adding four-dimensional data assimilation by analysis nudging to the Model for Prediction Across Scales – Atmosphere (version 4.0), Geosci. Model Dev., 11, 2897–2922, https://doi.org/10.5194/gmd-11-2897-2018, 2018.
[2] https://www2.mmm.ucar.edu/wrf/users/docs/ObsNudgingGuide.pdf