Capability of CPAS in predicting Typhoon Higos
Co-authors: Anson Tang, William Leung
(*all dates and times are in Hong Kong Time (UTC+8) unless otherwise specified)
Initial developments of Higos
The precursor of Higos was a broad low associated with an easterly wave near the Philippines. Its “embryo” first developed into a rather small-scale low pressure area (LPA), which then entered the southern part of the Luzon Strait on 17 Aug.
Forecast errors in Higos’ track and intensity
This LPA then developed into a tropical cyclone (TC) named "Higos" in the early morning of 18 Aug. Meanwhile, at 00Z, 18 Aug (08 HKT), global numerical weather prediction (NWP) models, such as the European and the US models, generally forecast Higos would develop slowly and make landfall in western Guangdong as a tropical storm (TS) with a minimum mean sea level pressure (MSLP) of approximately 995-1000 hPa in the morning on 19 Aug (HKT).
However, Higos underwent an unexpected rapid intensification under favorable atmospheric conditions within a 24-hour period and deviated northward from its initial forecast track. It made landfall to the west of the Pearl River Estuary (which is ~100 km more east than most global models) in Zhuhai as a typhoon (TY), with an estimated min. MSLP and max. 10-min. sustained wind speed of about 980 hPa and 135 km/h (~38 m/s), respectively, at around 6 a.m. on 19 Aug ([1]). Eventually, Higos’ closest distance to Hong Kong is approximately 80 km, which is considerably smaller than the original forecast distance of about 150-200 km by most global models.
Comparison of the forecast tracks of Higos by global models and actual track by the Hong Kong Observatory (HKO):
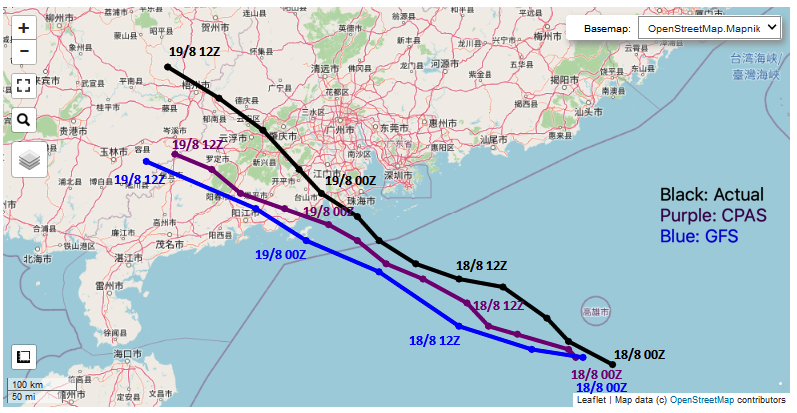
(Purple: forecast track of Higos by CPAS; Blue: forecast track of Higos by GFS (US model); Black: Actual positions of Higos by HKO [2])
The performance of CPAS model in predicting Higos
The CPAS global model used GFS’ initial conditions at 00Z, 18 Aug for the simulation of Higos. With a 128-8-4 km mesh with 159,041 cells (128km resolution around the globe, and 8 km resolution in the target region around usual tracks of TCs, and 4 km resolution for orographic and coastal boosts) and MPAS-A physics schemes, CPAS was able to provide a reasonably accurate prediction of Higos’ movement and intensity.
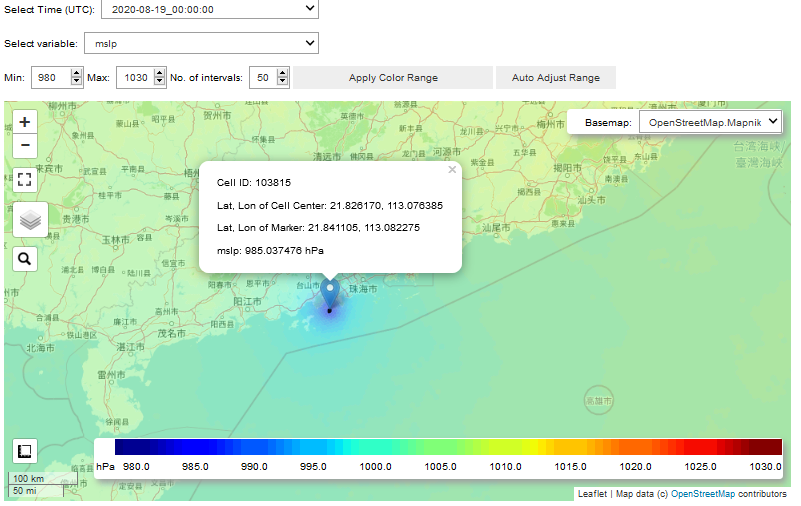
The forecast min. MSLP and max. sustained wind speed of Higos at 00Z, 19 Aug (+24 hour forecast) by CPAS were about 985 hPa and 28 m/s, respectively, which were relatively close to observations compared to the US model - GFS forecast for the same forecast time (~998 hPa, ~20 m/s). Besides, the predicted landfall location of Higos was only a few tens of kilometers to the west of the actual track. This showcases that the finer resolution (8-4 km vs 13 km in GFS) in CPAS over the target region and the physics schemes in MPAS-A could potentially provide extra details in short-term tropical cyclone forecasts, such as the finer-scale wind speed distribution of the storm.
Although the skill of TC track forecasts has improved dramatically in recent decades, TC intensities remain rather less predictable, especially for small-scale TCs like Higos, which could be attributed to the underrepresentation of the sub-grid features in common global models. The variable resolution mesh in CPAS allows the model to resolve more smaller-scale atmospheric features and systems, as well as enables the user to allocate computing resources accordingly and flexibly. Therefore, CPAS could be practically useful as an alternative to the existing global NWP models for predicting small-scale TCs.
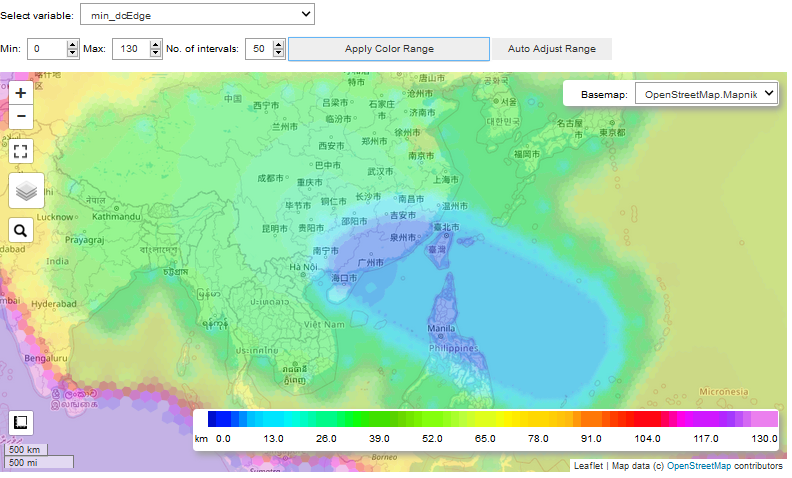
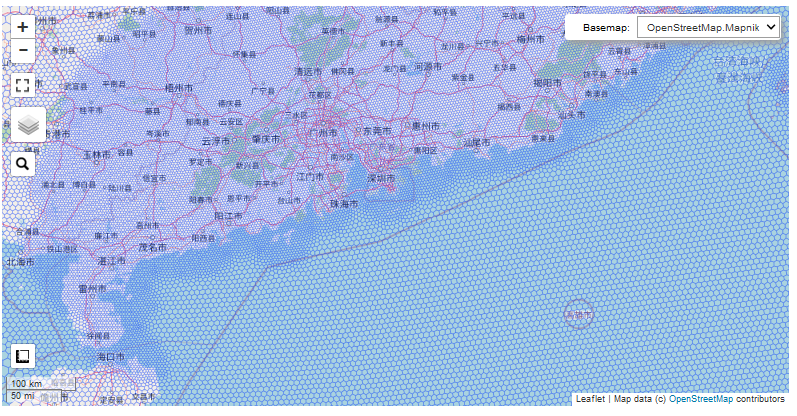
Mesh visualization of the mesh used (128-8-4 km) for predicting Typhoon Higos in CPAS:
CPAS forecast MSLP at 00Z, Aug 19 (result visualized by its Jupyter cloud-computing service):
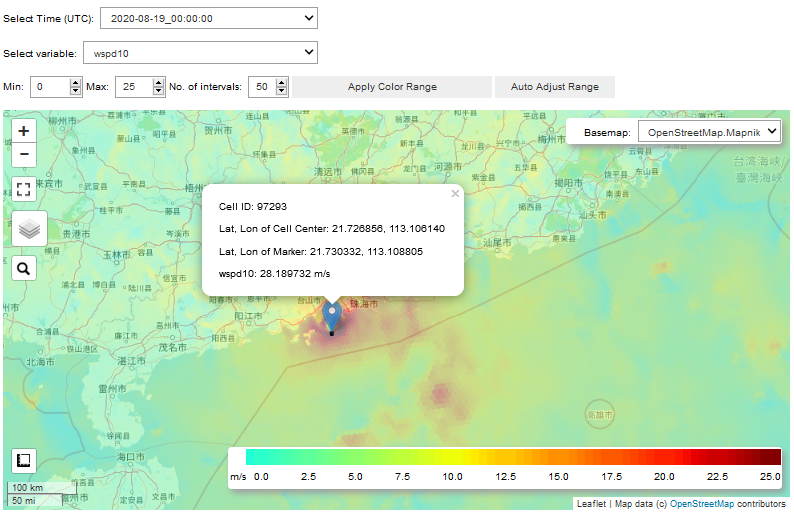
CPAS forecast 10-m wind speed at 00Z, Aug 19:
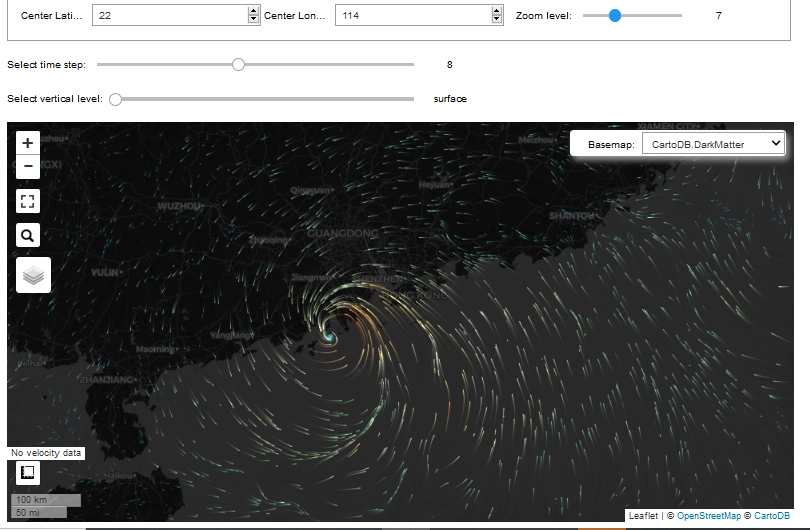
CPAS forecast 10-m wind field at 00Z, Aug 19 (also visualized by CPAS Jupyter cloud-computing service):
(EDIT: Adding an animation from the simulation by CPAS version 0.16.1)
References
[2]: Past Positions and Intensities by Hong Kong Observatory. Accessed 20 August 2020