Predicting a destructive tropical cyclone in Indian Ocean Fani with CPAS
Background
The Indian Ocean hosts major sea routes connecting the East and the West sides of the world (Central Intelligence Agency, 2022). Heavy traffic of goods and natural resources is common in the Indian Ocean.
However, active tropical cyclone activities severely impact the maritime traffic and shipping network in the Indian Ocean (Shen et al., 2019). It is therefore important to have accurate weather forecasting in the tropical cyclone basins so that precautionary actions can be taken in advance.
In this blog, the capability of CPAS in predicting the tropical cyclone in the Indian Ocean will be examined using the cyclone Fani as a case study.
Background of the cyclone Fani
Fani was formed as a tropical depression on 26 April, 2019. As it travelled northward in the Indian Ocean, it slowly developed. Not until 30 April, 2019 was it developed to a Category 1-equivalent cyclone. Thereafter, the cyclone continued to intensify rapidly and it reached a Category 5 hurricane after 2 May, 2019. It then made landfall near Puri, Odisha in India on 3 May 2019 and dissipated on 5 May 2019.
Mesh specification
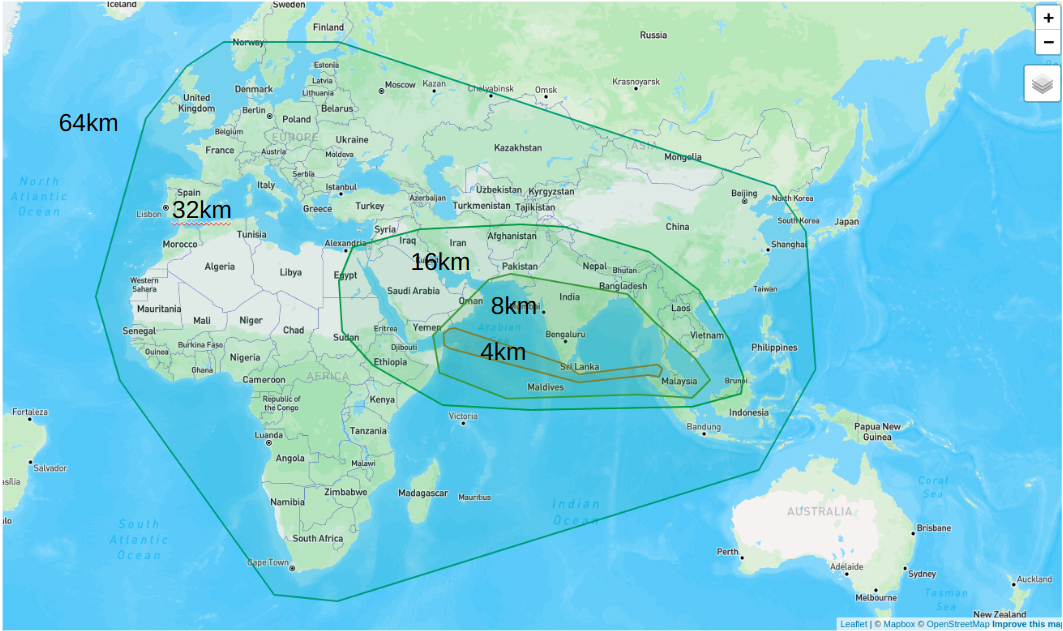
Fig. 1 shows the mesh used in this study. The coarsest resolution of the mesh is 64km, followed by 32km refinement around Eurasia and Africa, 16km refinement around Central and Southeast Asia, 8km refinement around the tropical cyclone basin in Northern Indian Ocean, and 4km refinement around the Indian Ocean trade route. The purpose of the mesh design is to make a decent prediction of the tropical cyclone, as well as to provide high-resolution simulation for the trade route.
Simulation setting
In this study, CPAS v1.1.0 is used. The forecast is initialized from the NCEP’s Global Forecast System (GFS) data at 2019-04-27 00Z, and the simulation length is 5.5 days. The physics scheme used is mesoscale reference suite.
Results
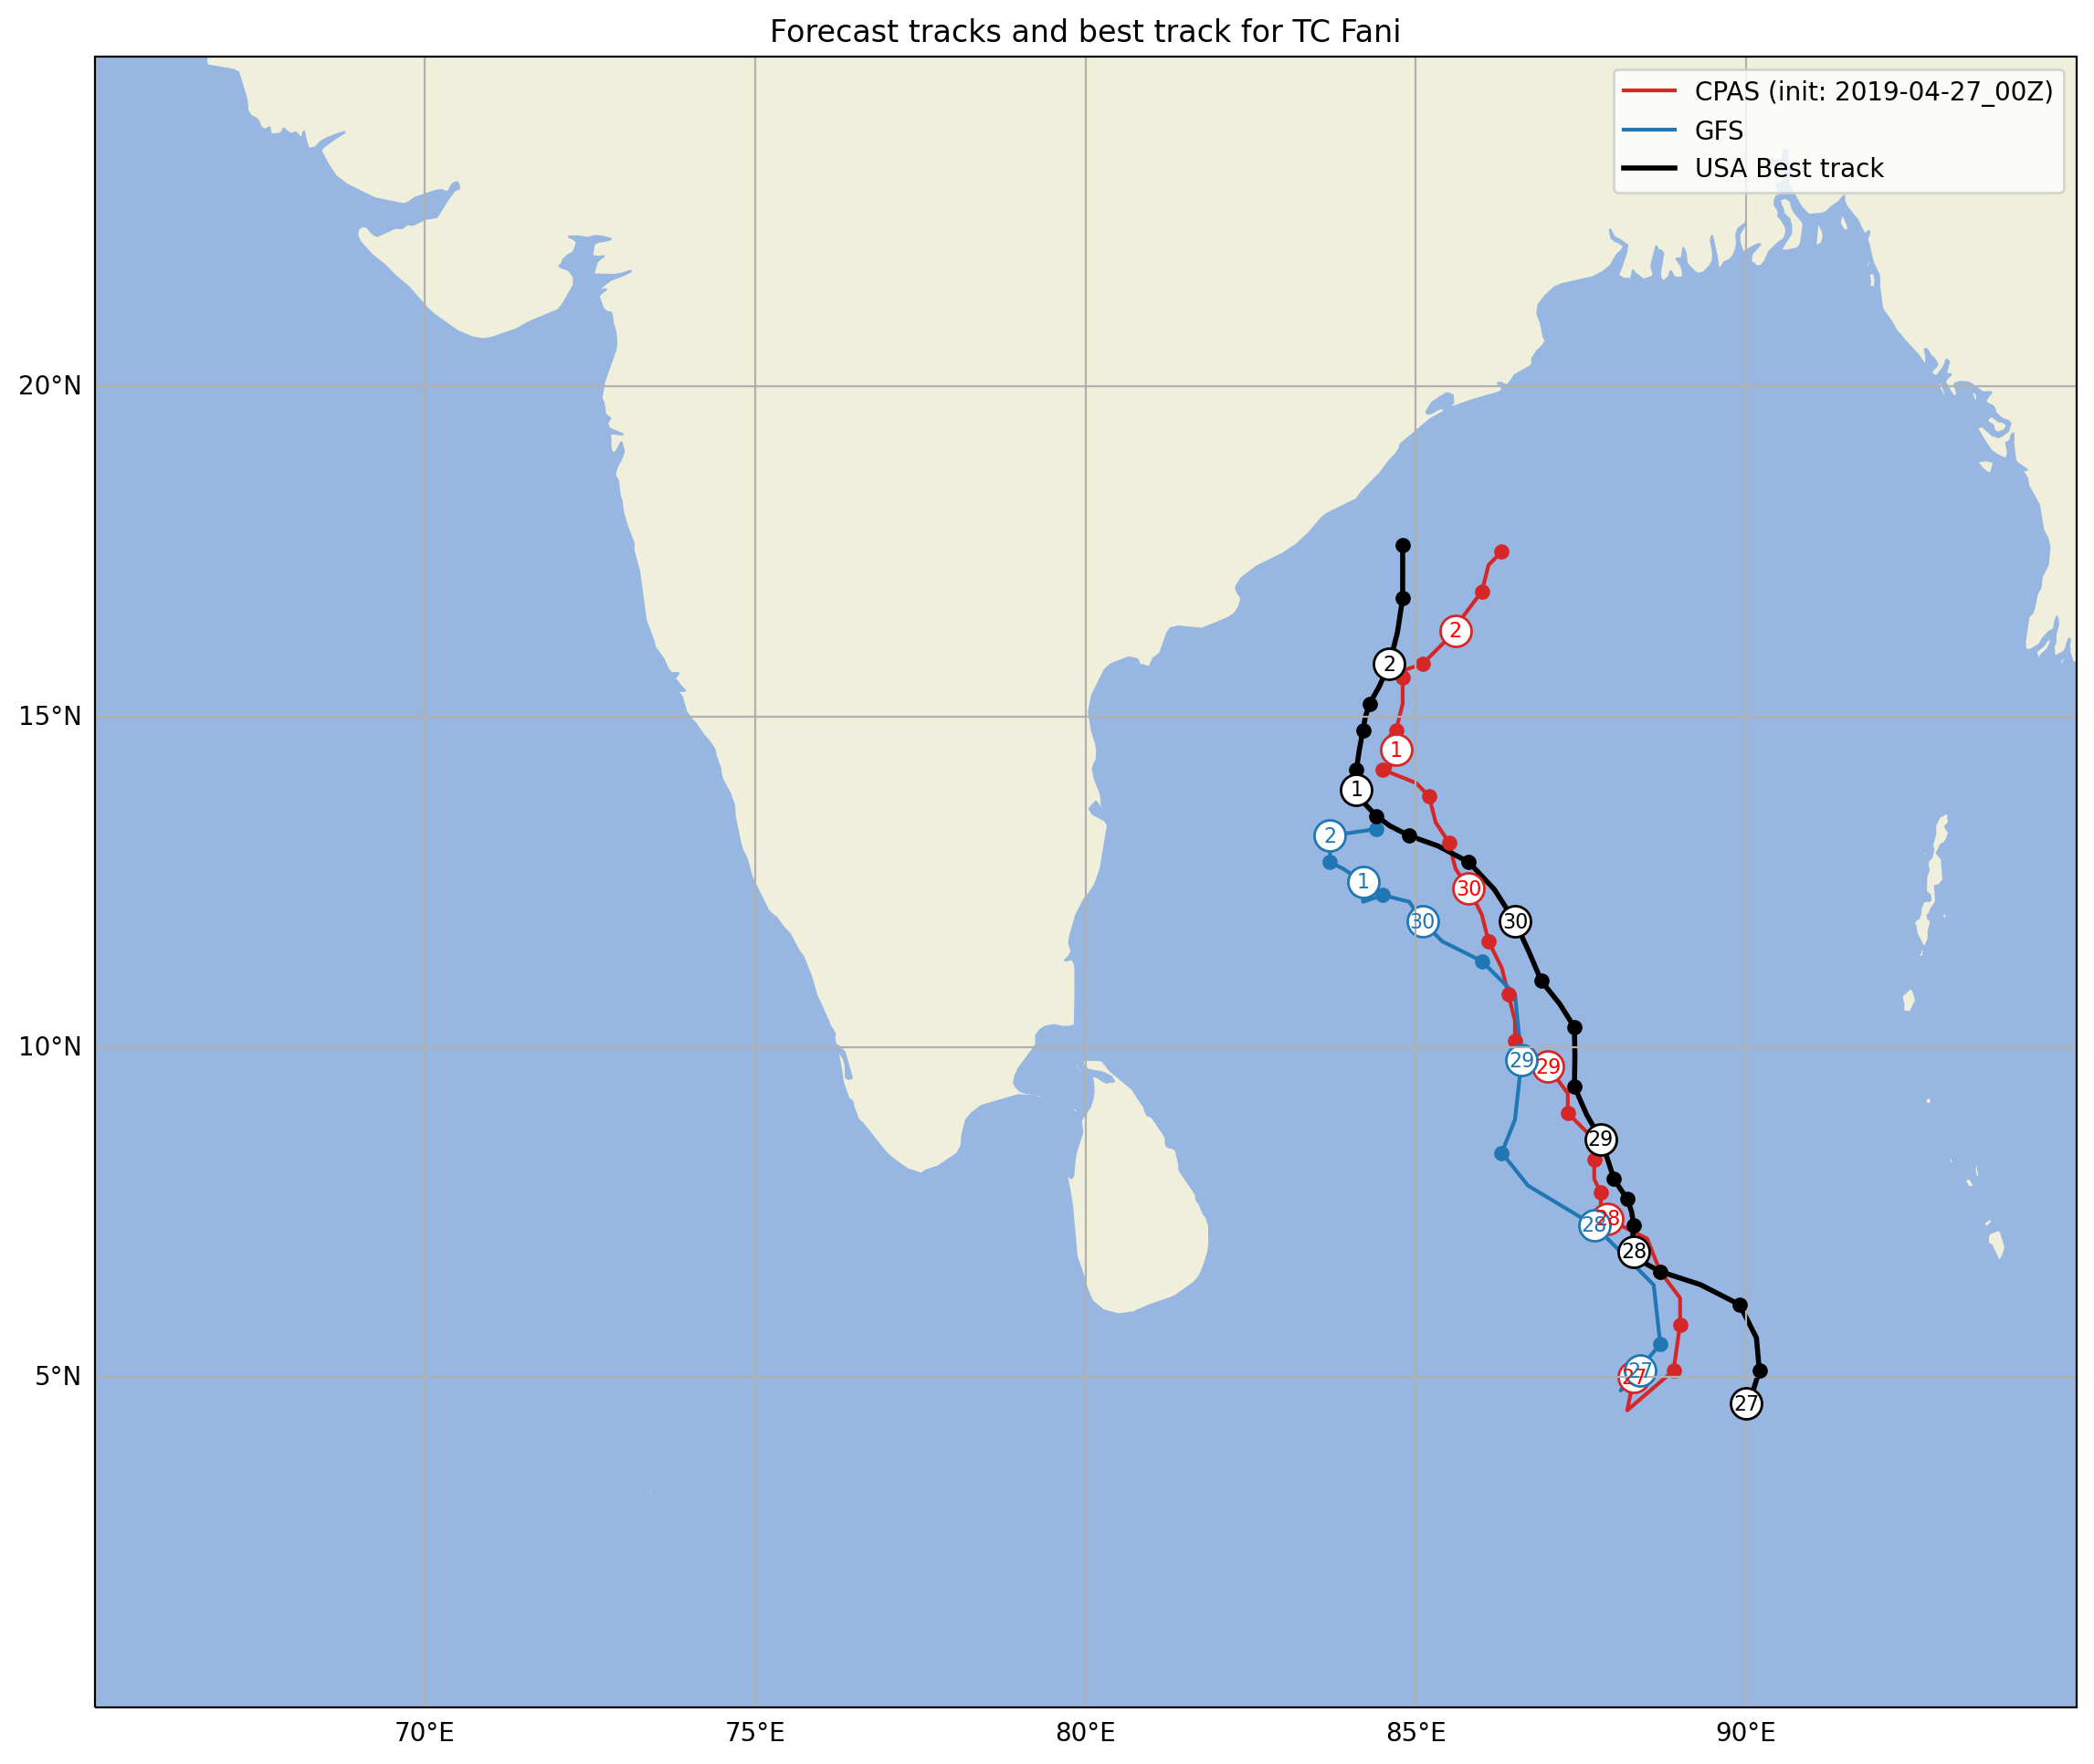
Fig. 2 shows that CPAS has a satisfactory performance in forecasting the track of Fani. In terms of both the movement speed and position, CPAS is able to simulate the cyclone similar to the best track. When compared to the GFS forecast, the cyclone position of CPAS is closer to the best track along all forecast hours. In the later part of the forecast (i.e. after 30th April), GFS is unable to simulate the movement speed correctly, resulting in a huge position error. On the other hand, CPAS still maintains a decent performance in the later part of the forecast.
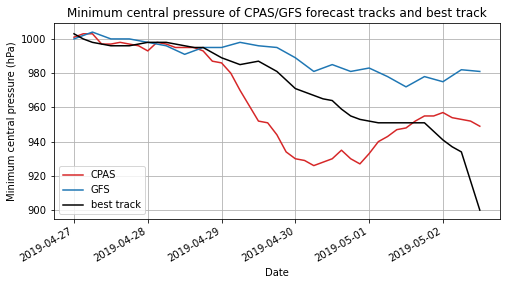
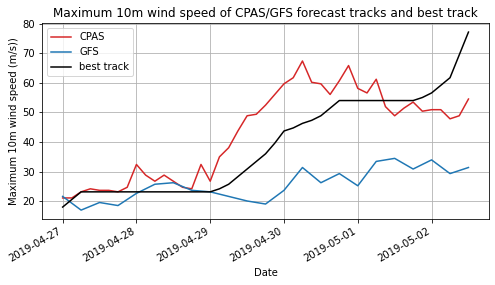
The intensity of the tropical cyclone by CPAS/GFS forecasts and the best track are shown in terms of minimum central pressure (Fig. 3) and maximum 10-meter wind speed (Fig. 4). In general, CPAS tends to overpredict the intensity while GFS tends to underpredict. In the first 2 days of forecast, both CPAS and GFS perform well. On 2019-04-29 00Z, Fani started to intensify. CPAS is able to simulate the intensification at the exact time but GFS fails to do so. After 2019-05-02 00Z, Fani underwent even stronger intensification, but both CPAS and GFS failed to simulate this event. Overall, CPAS shows satisfactory results in predicting the intensity of Fani in the first 5 days of forecast.
In conclusion, CPAS performed decently in predicting the tropical cyclone Fani in terms of both position and intensity, which indicates that CPAS is capable of predicting tropical cyclones in the Indian Ocean.
Reference
- Central Intelligence Agency. (27 Dec, 2022). The World Factbook - Indian Ocean. Retrieved 16 May, 2023 from https://www.cia.gov/the-world-factbook/about/archives/2022/oceans/indian-ocean/#government
- Shen Z., Xu X., Li J., & Wang S. (2019). Vulnerability of the maritime network to tropical cyclones in the Northwest Pacific and the northern Indian Ocean. Sustainability, 11(21), 6176. https://doi.org/10.3390/su11216176